Directional movement index
Separates positive and negative directional movement and measures trend strength.
Purpose and construction
Separates positive and negative directional movement and measures trend strength.
Directional movement index is applied to the chart series using the local definition below. Each period counts one bar on the active chart. The same period therefore covers a different amount of time on daily and intraday charts.
How to read it
Compare +DI and −DI for direction; ADX describes strength without specifying direction.
Confirm the inputs and settings before comparing the indicator with price. On an open bar, close, extremes and volume can still change, so the reading can update before the bar closes.
Parameters
| Parameter | Default |
|---|---|
N | 14 |
MM | 6 |
Parameter names match the variables in the calculation. After changing a lookback or smoothing period, recalculate on the same data to compare response speed. Defaults from another platform may not match this definition.
Original illustrated case
This original daily-bar case moves through an advance, a pullback and a wider-range recovery. It does not represent a real security. Where available, outputs are calculated by the project’s formula engine using the defaults above.
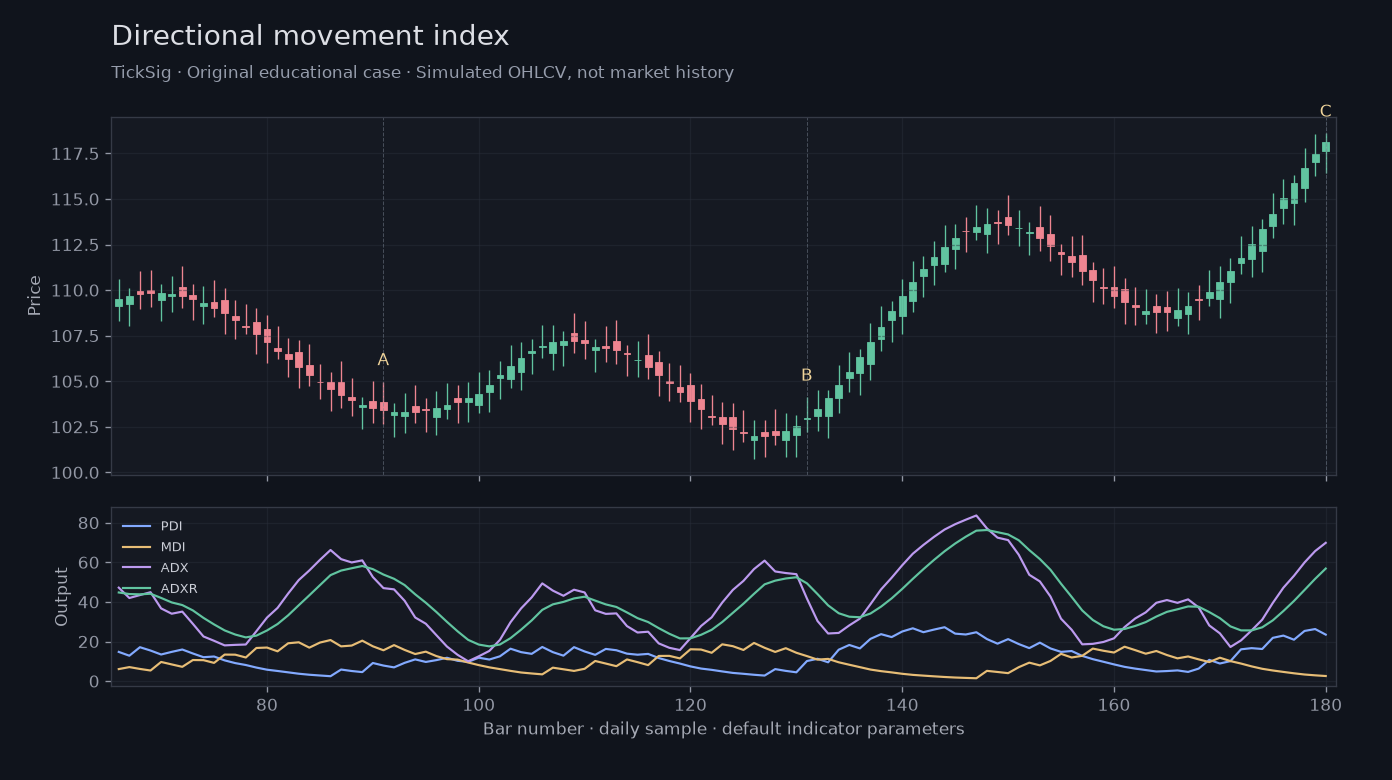
From bar 91 to bar 180, the close rose from 103.403 to 118.1487. Compare each output below, then use the reading rules above to distinguish direction, momentum, participation or a pattern condition.
| Point | Bar | Close | Volume | Calculated outputs |
|---|---|---|---|---|
| A | 91 | 103.403 | 14187 | PDI: 7.8527MDI: 15.5733ADX: 46.9599ADXR: 53.8022 |
| B | 131 | 102.9777 | 19368 | PDI: 10.1398MDI: 12.6271ADX: 41.6928ADXR: 49.3717 |
| C | 180 | 118.1487 | 15024 | PDI: 23.472MDI: 2.5709ADX: 69.8332ADXR: 56.8376 |
At A, PDI 7.8527 is below MDI 15.5733 while ADX is 46.9599: strength can accompany a downward direction. At C, PDI 23.4720 exceeds MDI 2.5709 and ADX is 69.8332. The direction comparison and the strength reading should be stated separately.
To reproduce: retain the same OHLCV series and default settings, then compare outputs bar by bar. Warm-up bars can have no value. The case-generation script and local definition are stored with the project, so plotted curves are calculated rather than hand-drawn.
Local calculation
The local definition is shown below. Display labels can be translated; the case calculation uses original source identifiers. A shared indicator name does not guarantee identical calculations across platforms.
MTR:=EXPMEMA(MAX(MAX(HIGH-LOW,ABS(HIGH-REF(CLOSE,1))),ABS(REF(CLOSE,1)-LOW)),N);
HD :=HIGH-REF(HIGH,1);
LD :=REF(LOW,1)-LOW;
DMP:=EXPMEMA(IF(HD>0&&HD>LD,HD,0),N);
DMM:=EXPMEMA(IF(LD>0&&LD>HD,LD,0),N);
PDI: DMP*100/MTR;
MDI: DMM*100/MTR;
ADX: EXPMEMA(ABS(MDI-PDI)/(MDI+PDI)*100,MM);
ADXR:EXPMEMA(ADX,MM);
Limitations
- Compare +DI and −DI for direction; ADX describes strength without specifying direction.
- Timeframe, adjustments, warm-up length and data units affect results. Align these before comparing charts.
Questions
Why can Directional movement index differ across platforms?
Compare inputs, default periods, smoothing, offsets and data units before comparing the final value. This guide uses the local source definition rather than assuming that an external example has the same settings.
Does the example show a real trade?
No. The figure and table use simulated data to explain calculations and chart reading. They contain no real orders and make no return or win-rate claim.
References
The calculation comes from the project’s indicator registry. Primary references below provide related conceptual reading. Figures and numerical cases are independently produced for this project.